Site-wide Statistics give you a bird’s eye view of the activity in your community. You can see how many people are viewing your site, how many signups you have during a chosen period, and other site tracking features. Statistics are displayed in a graphical format for easy viewing.
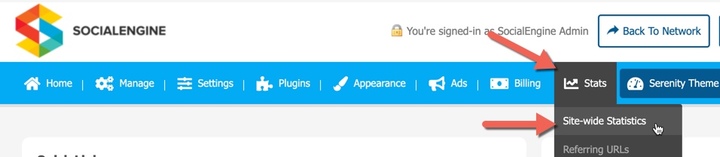
Accessing the Site-wide Statistics Page
The Site-wide Statistics Page is accessed in the Admin Panel by navigating to Stats > Site-wide Statistics.
Selecting Data to View
- Select which type of data to view by clicking on the arrow next to "All". It will open a drop-down menu where you can choose to view either “All,” or “Cumulative" activity during a given period.
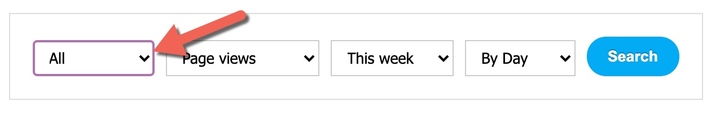
All
The amount of activity created in the given period of time. For example, we have had three sign ups in a week.
Cumulative
The total amount of activity created since the start of the site. For example, we have 50 sign ups total now on the site.
- Select which type of activity to view by clicking on the arrow next to "Page Views". It will open a drop-down menu where you can select which type of activity you would like to view: “Announcements,” “Comments,” “Emails Sent,” “Likes,” “Abuse Reports,” “Page views,” “Private messages,” “Sign-ups,” “New friendships,” and “Sign-ins.”
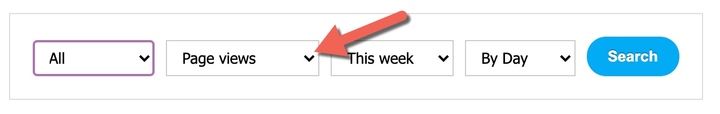
- Select which period of time to view by clicking on the arrow next to "This week". It will open a drop-down menu where you can select the overall period of time to view which would be either “This week,” “This month,” or “This year.”
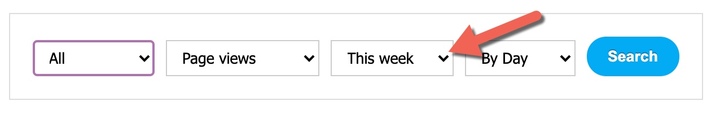
- Select how you would like to group the data by clicking on the arrow next to "By Day". It will open a drop-down menu where you can select how you would like to group the data within the specified period of time: “By Day,” “By Week,” or “By Month.”
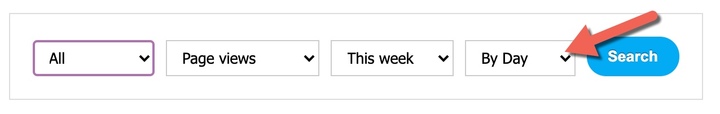
Note that you cannot select an option to group data that is larger than the period of time you have selected to view. You will receive and error. For instance, you cannot select to view the data “By Month” if you are only looking at data for “This week.”
- After you have decided which type of graph you want to see, click on the “Search Button.”
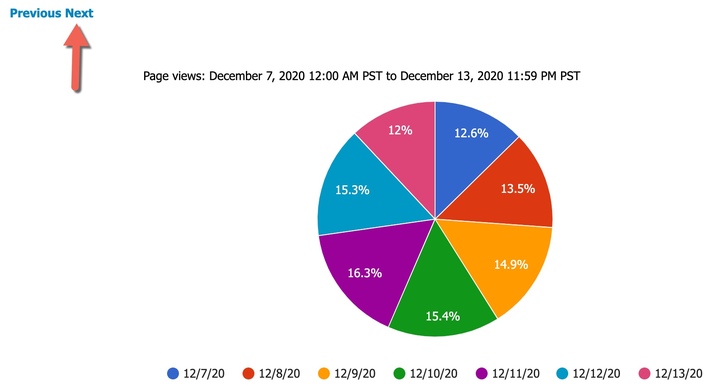
Interpreting the Graph
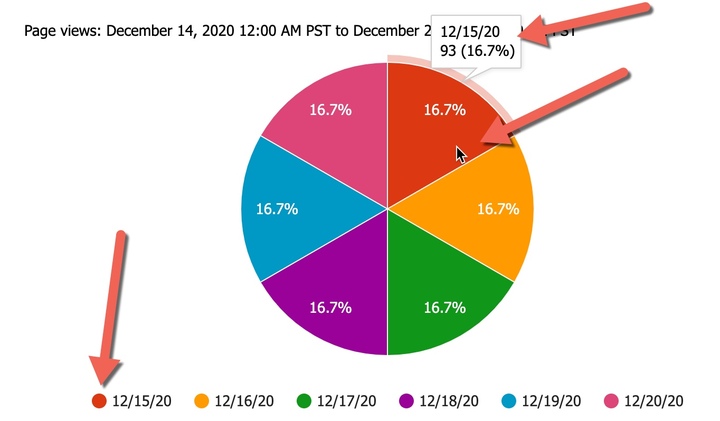
A pie chart will show the information that you have selected to view. If you hover your mouse over any point of the pie, you will see the exact amount of activity at that point of time.
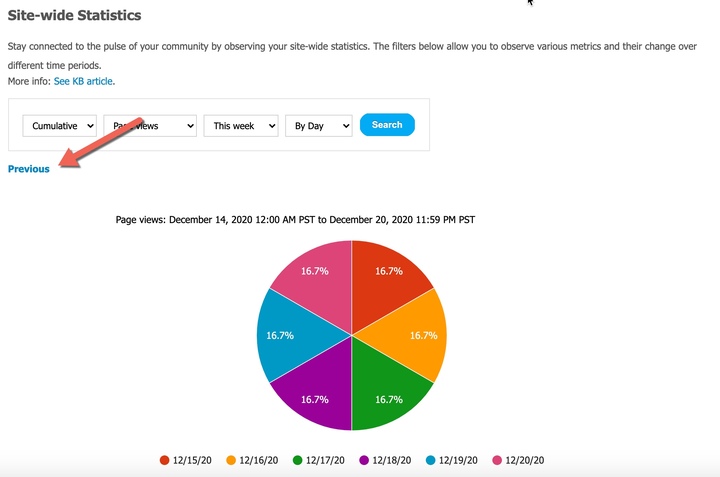
Viewing the Previous Period of Time
If you would like to view the previous period of time, click on the "Previous" button above the upper left corner of the chart.
Viewing the Next Period of Time
If you are not already viewing a period of time that shows today's date and would like to see the next period of time, click on the "Next" button to the right of the "Previous" button above the upper left corner of the chart.