Notifications
The “Log Browser” allows you to view the error Logs of different portions of your site to see if there are any issues that might interfere with the operation of your site. Too many errors or frequent errors can cause your site to slow down. Therefore, it is recommended that you check your error Logs frequently for errors that might occur.
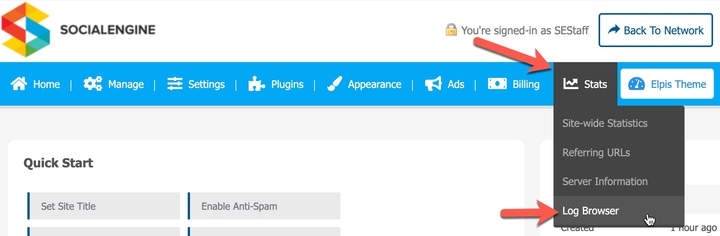
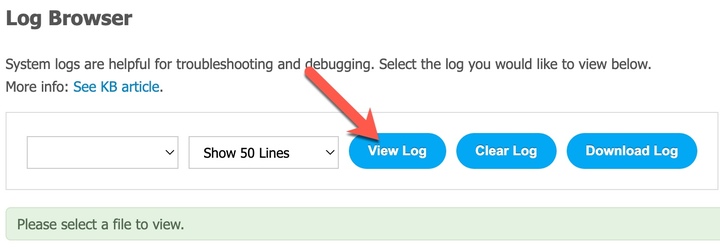
To reach the “Log Browser” page, in your Admin Panel navigate to Stats > Log Browser.
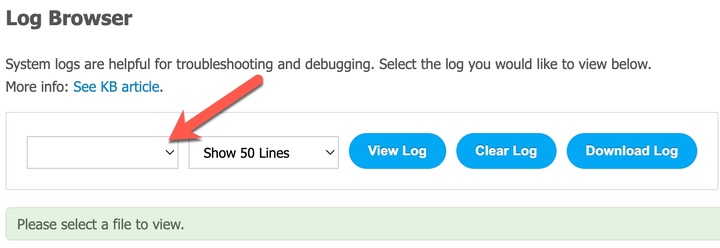
To select a Log to view, click on the arrow of the first select box on the left.
Depending on whether your site is in “Production mode” or “Development mode”, you may see extra Logs available for viewing. Also, some third-party plugins have their own Logs that you may be able to view.
The standard Logs are as follows:
The “Error Log” is your main Log that displays errors that may occur all over the site.
The “Task Scheduler Log” displays the processes of the Task Scheduler. It shows whether tasks were executed or not and why some scheduled jobs were not run or are on pause. This Log is only created after the Task Scheduler has run at least once while the site is in Development mode.
The “Language Log” displays any messages that might not have been translated in a language pack.
The “Video Encoding Log” displays the encoding processes of each video that is encoded with the Video Plugin. If a video fails to encode, this Log would be a good starting point to find out why the video was unable to complete its encoding. This Log is only created if you have the Video plugin installed and any member on the site has attempted to upload at least one video.
The “Install Log” displays the installation process of modules and plugins during installation or upgrades. If there were any errors that came up during installs or upgrades, those errors will show up in the Install Log.
The “Mail Log” displays mail that is sent out from the server. This Log is only created after mail has been sent out at least once while the site is in Development mode.
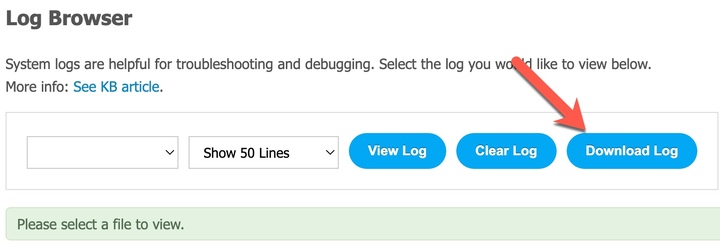
Once you’ve chosen which Log you want to view, you can choose to download this Log which could make it easier to search for specific errors. To download the Log, click “Download Log”.
If you want to view your chosen Log in your Admin Panel, click “View Log”.
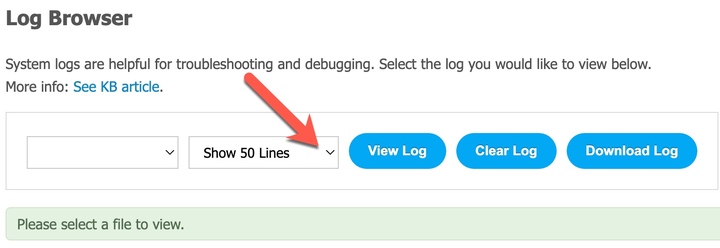
Click the arrow to the right of "Show 50 Lines" to choose 10, 50, 100, 500, 1000, 5000, 10000, or 50000 lines of the error Log to show at a time.
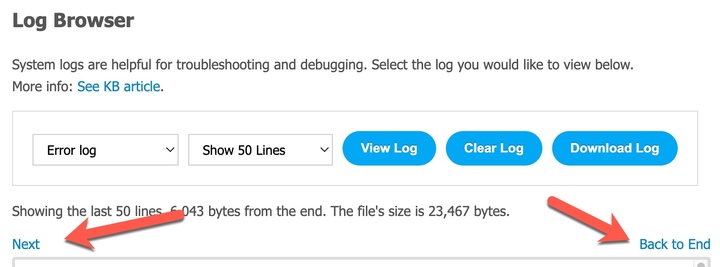
To see more lines of an error Log, you can view the next increment of lines by clicking on the “Next” button which is located above the Log viewing window. The number of lines shown will depend on how many lines have been selected to be shown and whether there are any more lines of the Log available to view. You can also click "Back to End" to see the beginning of the log.
There are 4 different types of errors:
WARN: Warnings won't break your site; however, they can let you know there is something in the code that should be fixed to run properly.
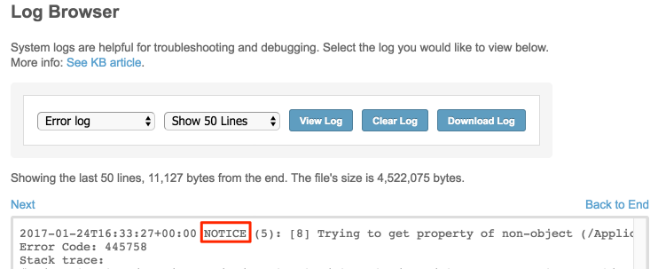
NOTICE: Notices also won't stop a page from loading, but they can help in trying to nail down something that is causing your site to break.
CRIT: Critical messages can usually mean that a page failed to load for some reason.
FATAL ERROR: Fatal errors are usually noted when the site is broken and is not able to function or a page will not load.
For more detailed information about the different types of errors and how to possibly debug these errors, you should look into studying and understanding how to debug PHP.
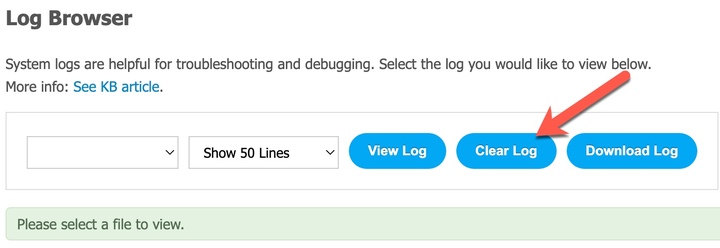
If you want to clear the error Logs and start fresh records, click the “Clear Log” for your chosen Log.